Compound interest / Investing
The Cost of Waiting Five Years to Start Investing
Compare 25 and 30 years of $500 monthly deposits. Separate contributions from modeled growth and calculate a later-start catch-up amount with clear assumptions.
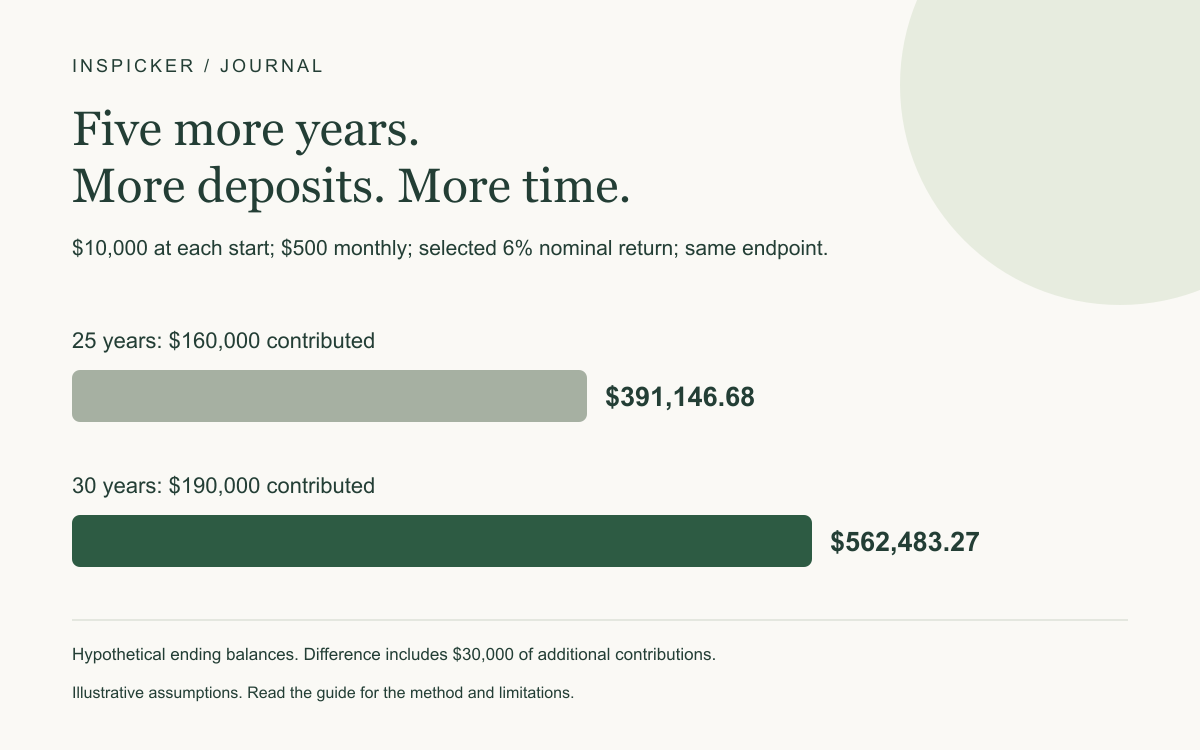
In a hypothetical monthly-compounding example, starting five years earlier produces $562,483.27 instead of $391,146.68 at the same endpoint. Both paths begin with $10,000 at their respective start dates, add $500 at each month-end, and use a selected constant 6% nominal annual return. One runs for 30 years; the other runs for 25.
The $171,336.59 modeled difference includes both $30,000 of additional deposits and the difference in growth. It is not a guaranteed investment outcome or a pure measure of interest on identical contributions.
Use the compound interest calculator to compare the time available for your own goal. Keep the assumptions visible: a longer horizon changes the number of contributions as well as the time money can compound.
Compare age 35 with age 40, ending at age 65
For a clear illustration, imagine two alternative paths to the same age-65 endpoint. These ages identify time horizons; the example does not model retirement eligibility, account rules, or withdrawals.
| Selected assumption | Earlier start | Later start |
|---|---|---|
| Starting age | 35 | 40 |
| Endpoint age | 65 | 65 |
| Years of contributions | 30 | 25 |
| Initial amount at that path’s start | $10,000 | $10,000 |
| Monthly deposit | $500 | $500 |
| Nominal annual return | 6% | 6% |
| Deposit timing | Month-end | Month-end |
The later path begins with $10,000 at age 40. The calculation does not track where that money was held before then, what it earned, or what happened to the $500 not invested during the first five years. It is an investment-account comparison, not a complete household net-worth comparison.
This distinction matters. If the delayed contributions instead paid down debt, covered essential bills, or built a cash reserve, those uses have their own consequences. The final investment balance alone cannot establish which overall household decision was best.
Compare money deposited with modeled growth
The monthly model produces the following amounts:
| Result at the common endpoint | 30-year path | 25-year path |
|---|---|---|
| Number of monthly deposits | 360 | 300 |
| Initial amount plus deposits | $190,000 | $160,000 |
| Modeled growth above contributions | $372,483.27 | $231,146.68 |
| Projected ending balance | $562,483.27 | $391,146.68 |
Contributions are $10,000 + $500 × months. Growth is the ending balance minus that contributed amount. Both columns are future dollar balances before taxes or fees; inflation has been set to 0% for this comparison.
The Investor.gov introduction to investing explains compound growth as returns building on both invested money and previous returns. It also discusses how the time available and regular contributions affect a long-term plan. The figures here are InsPicker’s original hypothetical calculation, not results copied from that source.
Why is the gap larger than the extra $30,000 deposited?
Starting at 35 adds 60 monthly deposits of $500, totaling $30,000. It also gives the initial balance and the earlier deposits more months in the model. Subsequent returns apply to balances that already include prior growth.
The final balance gap can be reconciled as:
| Component of the ending difference | Amount |
|---|---|
| Additional contributions | $30,000.00 |
| Difference in modeled growth | $141,336.59 |
| Total projected balance difference | $171,336.59 |
Calling the entire $171,336.59 “interest lost” would hide the extra contributions. It would also imply certainty that the selected return will occur. The more accurate interpretation is a difference between two defined contribution-and-return scenarios.
Each month, InsPicker applies previous balance × (1 + 0.06 ÷ 12) + $500. The $500 arrives after that month’s growth. At a 0% return, the ending balances would simply be $190,000 and $160,000, making the gap exactly the additional $30,000 contributed.
What would the later starter need to deposit?
Keep the later path’s $10,000 initial amount, 25-year horizon, and selected 6% nominal annual return. To target the earlier path’s unrounded ending balance, the model requires approximately $747.241106 per month.
Rounded upward to cents, that becomes $747.25 monthly, an increase of $247.25 over the original $500 deposit. Rounding upward produces a small amount above the exact modeled target.
This is a mathematical catch-up amount under unchanged assumptions, not proof that it is affordable or sufficient in actual markets. The target itself came from an assumed return. Replacing one assumed outcome with another contribution calculation does not turn it into a guaranteed future balance.
Use the savings goal calculator for this reverse calculation and check the contribution against your monthly budget. If you are modeling workplace retirement saving, our retirement salary-growth guide covers changing contributions and matching assumptions that this flat-dollar example excludes.
A constant 6% is a scenario, not a forecast
The model uses a nominal annual rate divided by twelve. That means 0.5% growth every month in this example. It is not a historical market series, a promised account yield, or the same input convention as a 6% effective annual return. Our APY and nominal-rate guide explains that distinction.
Actual investments can lose value. The selected rate does not describe volatility or the order in which good and bad returns occur. Changing the rate changes both the projected gap and the catch-up amount.
The Investor.gov compound interest calculator makes the initial amount, contribution, time, rate, and compounding frequency explicit. Those are useful inputs to vary when testing a plan rather than relying on one final number.
Fees and taxes can reduce money retained, and inflation changes future purchasing power. These examples exclude all three. For an inflation-adjusted comparison at the same age-65 endpoint, use a consistent valuation date and inflation period for both paths; do not independently label a 25-year discount and a 30-year discount as the same “today.”
Starting earlier also does not mean investing money needed for immediate obligations. The emergency savings versus debt guide helps separate cash protection from debt repayment before assigning money to a longer-term goal.
Run the two horizons and then the catch-up scenario
- In the compound interest calculator, enter $10,000 initially, $500 monthly, 6% annual return, 30 years, and 0% inflation.
- Record the ending balance and contributed amount.
- Change only the horizon to 25 years and compare both results.
- In the savings goal calculator, use approximately $562,483.27 as the target, $10,000 already saved, 25 years, and 6% estimated annual return.
- Check the required deposit, then rerun with other return and contribution assumptions.
The model assumes fixed month-end deposits and monthly compounding. It excludes taxes, fees, contribution limits, employer matches, withdrawals, and investment volatility. It does not select an investment or establish that the projected balance can fund a particular retirement lifestyle.
Common questions
How much does waiting five years to invest cost?
There is no universal amount. In this selected $10,000-plus-$500-monthly example, 30 years instead of 25 produces a $171,336.59 ending-balance difference at a constant 6% nominal annual return. Different amounts, returns, and uses of money during the delay change the comparison.
Is all of the difference compound interest?
No. The earlier path includes $30,000 more contributions. The remaining $141,336.59 is the difference in modeled growth. Real investment growth is uncertain, and the example excludes taxes and fees.
Is it too late to start at 40?
The example does not establish a deadline for starting. It shows a 25-year path with substantial contributions and modeled growth. Calculate a realistic contribution and horizon for your situation rather than treating the earlier-start comparison as a reason to abandon the plan.
Can a higher return replace the missing five years?
Raising the assumed return can make a projection look larger, but it does not make that return available or certain. Compare changes you can budget—such as contributions, target amount, and timing—without assuming more investment risk will reliably close the gap.
Method: original hypothetical calculations checked against InsPicker’s compound-projection and savings-goal functions. Sources reviewed October 17, 2026. These scenarios are educational calculations, not investment recommendations or promised results.
For education and planning. Check assumptions and product terms before making a financial decision.
Put the numbers to work ↗