Retirement / Social Security
Social Security at 67 vs. 70: Calculate the Simple Break-Even
Work through a 67-versus-70 Social Security comparison with a $2,000 benefit. Calculate delayed credits, simple break-even, and the funding gap while waiting.
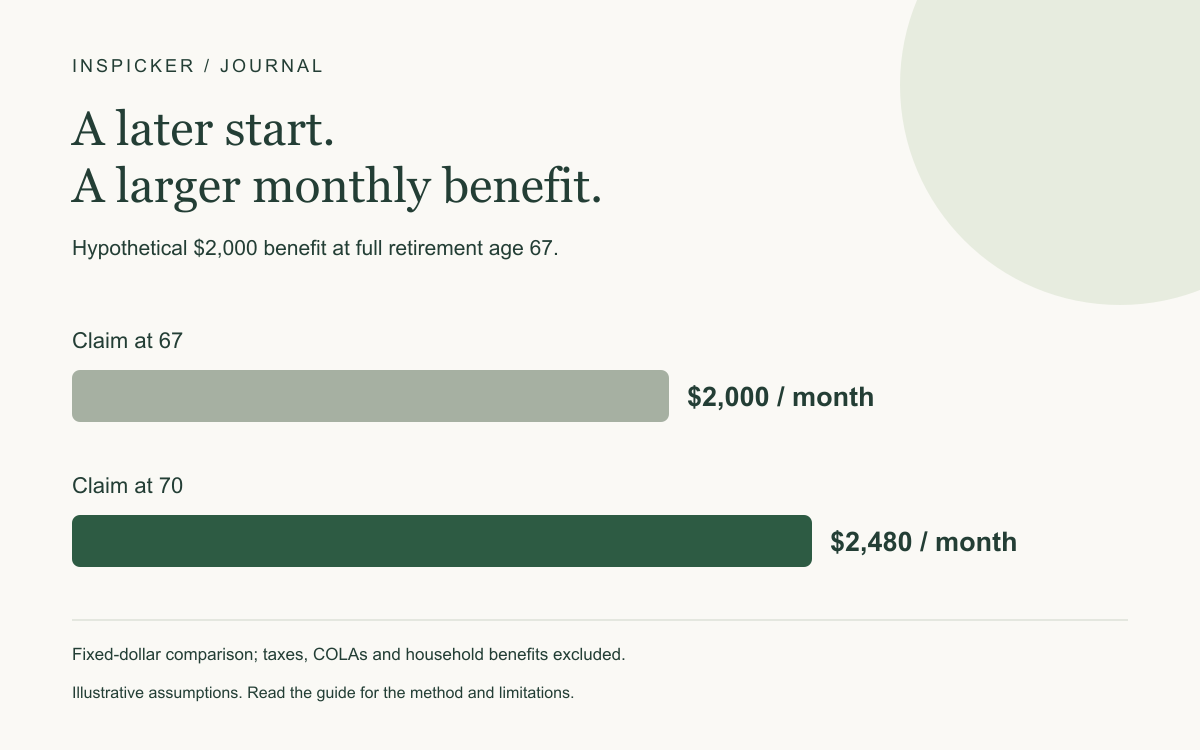
With full retirement age 67, delaying a hypothetical $2,000 monthly Social Security retirement benefit to age 70 increases it to approximately $2,480 before other changes. A simple comparison gives a cumulative break-even around age 82 years and 6 months.
That calculation compares 36 payments forgone with a later $480 monthly increase. It does not include taxes, investment returns, household survivor benefits, or the cost of funding living expenses while waiting.
Use the Social Security calculator as a scenario comparison, starting with an estimate based on your actual earnings record. The $2,000 input here is hypothetical, not an average or a benefit promise.
This example assumes full retirement age is 67
The comparison uses someone whose full retirement age is 67 and whose monthly retirement benefit at that age is $2,000. Full retirement age depends on birth year; 67 applies to people born in 1960 or later.
The Social Security Administration’s early-or-late retirement explanation provides the claiming-age adjustments and delayed-credit framework. The selected example uses the 8%-per-year delayed credit applicable to the relevant birth years.
Do not compare two estimates that also assume different future earnings and call the entire difference a claiming-age adjustment. Continued work can change a personal benefit estimate as well as supplying income during the waiting period.
If you want to compare beginning before full retirement age instead, see the separate 62-versus-67 example. Its early reductions and waiting interval are different from this article’s delayed-credit calculation.
Three years of delayed credits add 24% of the base benefit
For the selected 67-to-70 interval:
Delayed increase = 3 years × 8% = 24% of the full-retirement-age benefit.
The modeled monthly benefit at 70 is therefore:
$2,000 × 1.24 = $2,480.
The monthly difference is $480, or $5,760 over twelve payments. The credit is applied to the base benefit in this simplified comparison; it is not calculated as three years of investment compounding at 8%.
| Claiming choice | Modeled monthly benefit | Twelve monthly payments |
|---|---|---|
| Begin at 67 | $2,000 | $24,000 |
| Begin at 70 | $2,480 | $29,760 |
| Difference after 70 | $480 | $5,760 |
Cost-of-living adjustments and changes to the earnings record are excluded from these fixed-dollar figures. The model isolates claiming-age timing so the arithmetic is reproducible.
Divide the earlier payments by the later monthly increase
Between the selected ages, the earlier claimant receives 36 × $2,000 = $72,000 of payments that the later claimant forgoes.
After age 70, the later claimant receives $480 more each month. The simple catch-up interval is:
$72,000 ÷ $480 = 150 months, or 12 years and 6 months.
Adding that interval to age 70 gives approximately 82 years and 6 months.
This is an equal-payment-interval calculation. Actual application dates, benefit months, and payment dates can affect the calendar comparison. It should not be read as an exact check date or an individualized claiming recommendation.
The selected base amount does not change this simple ratio
Suppose the full-retirement-age benefit were $2,500 instead. The modeled age-70 amount would be $3,100, the earlier payments would total $90,000, and the later difference would be $600 monthly.
$90,000 ÷ $600 = the same 150 months.
That invariance comes from keeping the same claiming ages and proportional adjustment. It does not mean every household faces the same practical decision. Taxes, spouse-related benefits, living expenses, and other resources do not necessarily scale in the same way.
Waiting requires a plan for the missing income
The $72,000 comparison describes forgone retirement benefits; it is not automatically the amount a household must withdraw from savings. Actual bridge funding depends on total spending and other income during those three years.
For example, if other income leaves a $1,500 monthly spending gap, covering it for 36 months requires $54,000 before taxes, investment changes, or unexpected expenses. A different household could have no gap or a much larger one.
Map the gap year by year. Identify dependable income, planned withdrawals, major one-time expenses, and the accessible reserve you want to preserve. Do not assume a projected portfolio can supply withdrawals without regard to market conditions.
The retirement calculator helps explore accumulation assumptions, but it does not simulate this three-year withdrawal bridge. The budget planner can organize current spending; neither replaces a complete retirement cash-flow plan.
Simple break-even is only one view of the decision
The arithmetic treats every benefit dollar as comparable and does not discount later payments. If earlier benefits are invested or allow other assets to remain invested, the financial comparison changes. Those returns are uncertain rather than an automatic advantage.
Tax treatment can also differ when benefits interact with other income. The calculator does not calculate Social Security taxation, Medicare costs, or withdrawals from different account types.
Household benefits need attention too. A spouse’s or survivor’s outcome may depend on the earnings record and claiming choices involved. Consult SSA’s survivor information rather than assuming two individual break-even calculations capture the household result.
Finally, the goal may include higher income late in life rather than only maximizing a cumulative total by a chosen age. Longevity is uncertain. A single break-even number does not assign a probability to living beyond it or price the value of later income security for you.
Start from a current estimate and read its assumptions
Use an estimate from your personal Social Security record. Check the assumed future earnings and whether amounts are shown in today’s or future dollars. Keep the dollar convention consistent across the choices.
To reproduce this article’s adjustment, use a $2,000 full-retirement-age benefit with full retirement age 67, then compare 67 and 70. The resulting fixed-dollar monthly amounts should be $2,000 and $2,480 before any separately modeled adjustments.
SSA explains that stopping work can affect retirement benefits. If an estimate assumes continuing earnings that will not occur, review that assumption rather than treating the displayed amount as independent of the work decision.
Use break-even as a prompt to examine cash needs, household circumstances, and the waiting-period funding plan. It is not a substitute for confirming the actual benefit available under your record.
Common questions about claiming at 67 versus 70
Is the simple break-even always age 82½?
It follows from this selected full-retirement-age-67 example, a 24% delayed increase, and no other adjustments. Different claiming ages, taxes, investment assumptions, or household benefits require a different comparison.
Is delaying equivalent to earning a guaranteed 8% investment return?
No. Delayed credits change a benefit amount under the program’s rules. They do not create an investment account or return the forgone payments as liquid principal.
Do delayed retirement credits keep growing after 70?
SSA’s delayed-credit framework stops at 70. Do not extend the same 8%-per-year assumption indefinitely.
Does the calculator include the cost of living while waiting?
The simple claiming comparison does not build a household bridge-withdrawal plan. Model that funding need separately before using the result to make a decision.
Method: hypothetical $2,000 full-retirement-age benefit, 36 months of delay, 24% total delayed credit, and fixed-dollar equal payment intervals. Taxes, COLAs, investment returns, survivor calculations, and exact payment-calendar effects are excluded.
For education and planning. Check assumptions and product terms before making a financial decision.
Put the numbers to work ↗