Insurance / Life insurance
Term Life and Investing the Difference: Test the Return Assumption
Compare equal insurance budgets with a checked premium-gap example. Test investment returns and distinguish policy cash value, guarantees, taxes, and coverage.
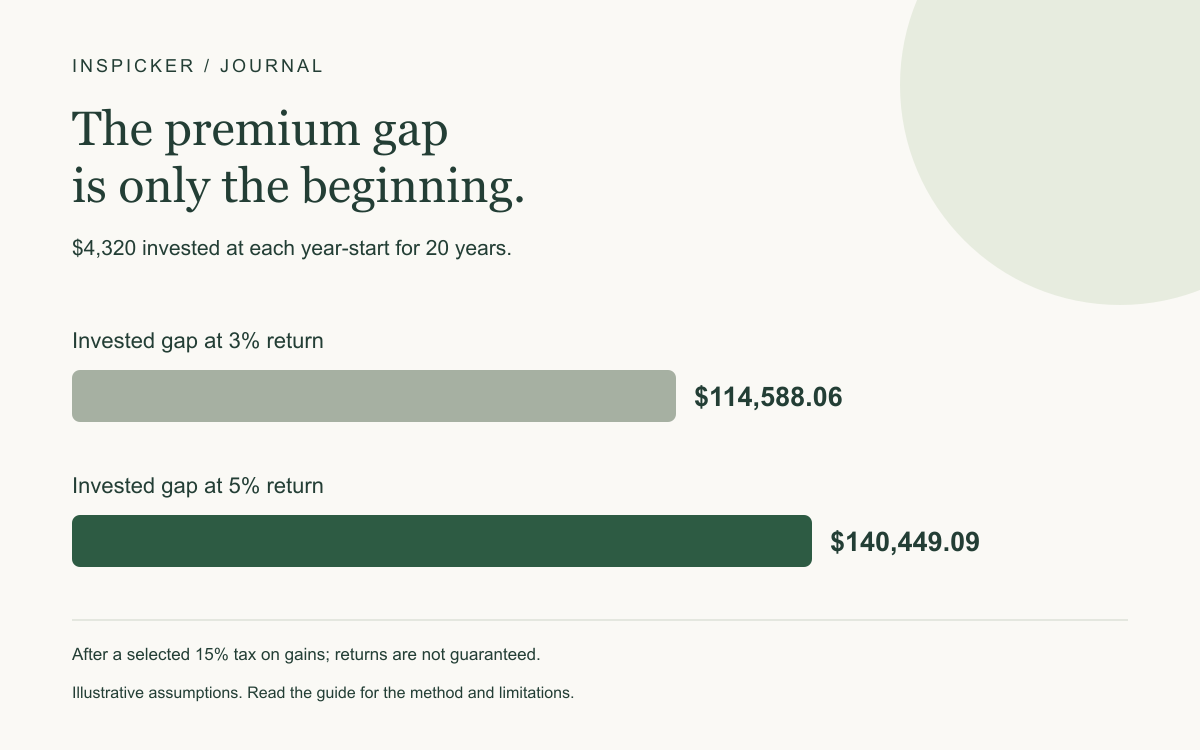
“Buy term and invest the difference” depends on the premium gap, the amount actually invested, investment results, taxes, and how long protection is needed. It is not a guaranteed investment strategy or proof that one insurance type is always better.
This worked example uses the same $4,800 annual budget for two paths. One pays a hypothetical $480 term premium and invests $4,320. The other pays a hypothetical $4,800 whole-life premium. After 20 years, the invested difference is approximately $140,449.09 after the selected tax assumption at a 5% annual return. A lower return can reverse the comparison with an entered $120,000 policy cash value.
Use the term vs. whole life calculator with actual quotes and the corresponding policy illustration. The cash-value input is supplied by you; the tool does not predict an insurer’s results.
First decide what the insurance needs to do
An insurance comparison starts with the amount and duration of protection, not just the account value at a later date. A family needing income replacement for 20 years faces a different problem from a household with an ongoing dependent or another lasting obligation.
The NAIC’s consumer life-insurance guidance distinguishes term protection from cash-value insurance and encourages readers to examine costs and guarantees. A premium comparison is useful only after confirming the policies address the relevant need.
The two premiums below are invented arithmetic inputs. They do not establish equivalent death benefits, actual underwriting results, or suitable coverage for a particular person. Obtain quotes with comparable insured amounts and review their differences before drawing a conclusion.
For a starting needs estimate, see the DIME method worked example. Avoid reducing needed protection simply to make a chosen investment comparison look favorable.
Give both paths the same annual spending commitment
| Input | Term plus investing | Whole life |
|---|---|---|
| Total annual budget | $4,800 | $4,800 |
| Annual policy premium | $480 | $4,800 |
| Annual amount invested separately | $4,320 | $0 |
| Comparison horizon | 20 years | 20 years |
| Policy cash value entered at year 20 | Not applicable | $120,000 |
The annual gap is $4,800 − $480 = $4,320. Over 20 years, that creates $86,400 of separate investment deposits if the household follows the plan every year.
If the household spends the gap instead, the investment account shown in the comparison will not exist. If it invests only part, use the amount actually invested rather than crediting an imaginary deposit.
This example assumes the quoted annual premiums remain as entered for the full comparison period. A different renewal schedule, policy charge, or planned premium change needs a revised calculation.
Make contribution timing and tax assumptions explicit
InsPicker’s tool invests the gap at the start of each year, then applies the selected annual return. With $4,320 deposited at the start of each of 20 years and a constant 5% return:
| Investment component | Amount |
|---|---|
| Total deposits | $86,400.00 |
| Projected investment balance before tax | $149,987.17 |
| Modeled gain | $63,587.17 |
| Tax on positive gains at the selected 15% rate | $9,538.08 |
| Projected balance after that tax | $140,449.09 |
The final tax calculation is deliberately simplified. It applies one selected rate to positive gains at the endpoint. It does not model annual distributions, tax-loss treatment, account-specific rules, state taxes, or the timing of realized gains.
The 15% input is not a statement of your tax bracket or a forecast of future tax law. Use an appropriate scenario for the account you intend to use and obtain tax-specific guidance where needed.
Starting-year contributions receive more growth than deposits made at the end of the year. Do not compare this result with a month-end or year-end calculator and assume a small difference is an error. Match the cash-flow timing first.
A lower return changes the conclusion
Keep the annual gap, comparison period, tax assumption, and entered policy cash value unchanged:
| Constant annual investment return | Investment balance after modeled gains tax | Difference from $120,000 policy cash value |
|---|---|---|
| 0% | $86,400.00 | −$33,600.00 |
| 3% | $114,588.06 | −$5,411.94 |
| 5% | $140,449.09 | $20,449.09 |
| 7% | $174,032.93 | $54,032.93 |
At 5%, the invested difference is higher than the entered cash value. At 3%, it is lower. These are conditional calculations, not probabilities or recommendations for an asset allocation.
A constant-return model smooths away market changes. Real returns may be negative, and the result depends on when gains and losses occur relative to deposits and withdrawals. The SEC’s investment-risk guide is a useful starting point for reviewing uncertainty rather than treating an assumed percentage as a promise.
This table also holds the policy cash value fixed to isolate the investment-return input. A non-guaranteed policy illustration has uncertainties of its own and should not be treated as a guaranteed benchmark.
Separate guaranteed values from illustrated possibilities
Ask for the year-specific policy values applicable to your comparison date. Identify which figures are guaranteed, which depend on non-guaranteed assumptions, and what premiums or conditions are required to maintain them.
The NAIC’s explanation of life-insurance illustrations describes the importance of distinguishing guaranteed and non-guaranteed elements. Do not take a highlighted future value out of context and compare it with a guaranteed cash deposit.
The $120,000 here is a selected input, not a quoted guarantee or an actuarial estimate. For a real comparison, confirm whether the relevant accessible amount is cash value or net cash surrender value, whether charges apply, and whether any policy loans reduce what would be received.
The simple tool does not deduct policy surrender charges or calculate policy-surrender taxes. Its comparison with an investment balance after a simplified tax calculation is therefore not a complete after-tax liquidation analysis. Reconcile both sides before relying on a small difference.
Cash value is only one part of the insurance decision
The calculator compares a separately accumulated investment balance with an entered policy value. It does not compare every outcome of the two policies.
Important missing questions include:
- What death benefit applies during the comparison period?
- What happens to protection after the term expires?
- Would new coverage require underwriting, and what might it cost?
- What happens if premiums are interrupted or investment deposits stop?
- How do policy loans, surrender terms, fees, and taxes affect accessible money?
Do not assume policy cash value is automatically paid in addition to the stated death benefit. Review the actual policy provisions. Similarly, an investment balance is not a substitute for an insurance death benefit while it is still small.
Consider affordability over the entire commitment. A plan that looks attractive on a year-20 chart but cannot be maintained through year five needs a different comparison. The budget planner can help test the annual premium and investment commitment against actual cash flow.
Common questions about investing the premium difference
Does term plus investing always produce more money?
No. In the selected example, a 3% return produces less than the entered $120,000 policy cash value, while 5% produces more. Actual results and policy values can differ from assumptions.
Is the whole-life cash value guaranteed here?
No guarantee is asserted. It is an invented $120,000 input. For your policy, distinguish guaranteed and non-guaranteed values and confirm the conditions attached to them.
Does the calculator compare death benefits?
It compares cash accumulation under a shared annual budget. It does not price equivalent protection, value coverage after term expiration, or model a death during the horizon.
Is the displayed comparison fully after tax?
No. It subtracts a simplified tax on investment gains but does not calculate every investment tax or policy-surrender tax. The actual spendable outcomes require a more complete comparison.
Method: hypothetical annual premiums, start-of-year investment deposits, constant returns, and a one-time selected tax on positive investment gains. Policy value is entered rather than estimated. This is a cash-accumulation scenario, not a personalized policy recommendation.
For education and planning. Check assumptions and product terms before making a financial decision.
Put the numbers to work ↗