Mortgage / Rent vs. buy
How Selling Costs Change Your Rent vs. Buy Break-Even
See how selling costs change a rent-versus-buy comparison at three, five, and ten years. Includes a checked example, renter investments, and model limitations.
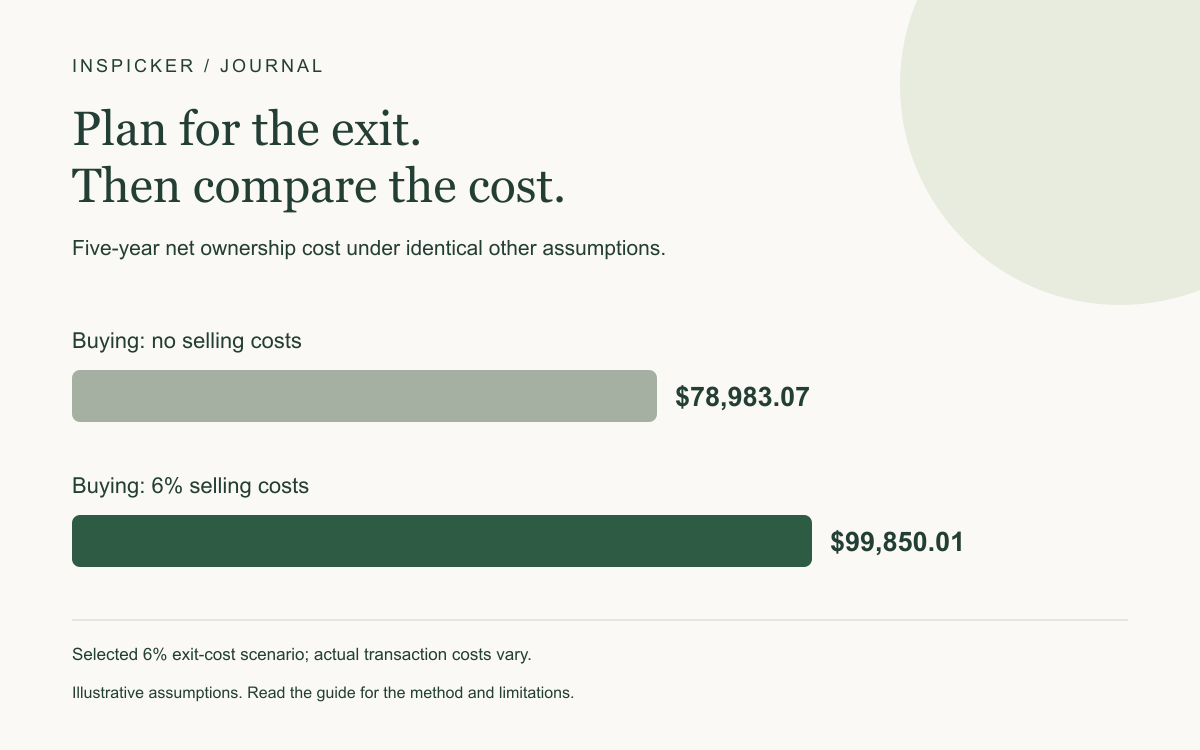
Home-selling costs can move a rent-versus-buy break-even point by years. If you plan to compare the two paths at a future move date, subtract the costs of selling before crediting the buyer’s remaining equity.
In the hypothetical example below, omitting selling costs makes buying appear cheaper at month 26. Including a selected 6% selling-cost assumption moves the first modeled crossover to month 67. After five years, renting is still approximately $3,524.42 cheaper under those inputs.
Use the rent vs. buy calculator to test your expected holding period. The 6% input is an illustrative combined exit-cost assumption, not a required commission, standard fee, or prediction for your market.
Break-even compares net costs at a chosen exit date
The buyer pays cash upfront and ongoing ownership expenses, but may receive sale proceeds after paying the mortgage and transaction costs. The renter pays rent and related costs while retaining money that was not used to buy.
InsPicker compares the modeled net cost of each path month by month. Buying crosses below renting when the buyer’s net cost is lower at a sampled month. This is not the point when the mortgage payment becomes lower than rent, nor the point when principal repayment equals the down payment.
The CFPB’s guidance on financial considerations when buying a home highlights the importance of transaction costs and how long you expect to stay. There is no universal number of years that makes every purchase financially preferable.
You may value stability, control over the home, or flexibility for reasons beyond the model. Those preferences matter, but they are not a reason to omit a financial cost from the calculation.
Use the same assumptions while changing only selling costs
This example uses the following hypothetical inputs:
| Input | Assumption |
|---|---|
| Home price | $300,000 |
| Down payment | $60,000, or 20% |
| Mortgage amount | $240,000 |
| Mortgage rate and term | 6.5% annually; 360 months |
| Buyer closing costs | $9,000 |
| Property tax | 1.2% annually of modeled current value |
| Home insurance | 0.4% annually of modeled current value |
| Maintenance allowance | 1.0% annually of modeled current value |
| Monthly HOA | $0 |
| Home appreciation | 3% annually |
| Starting monthly rent | $1,800 |
| Annual rent increase | 3% |
| Monthly renter’s insurance | $20 |
| Return on renter’s invested upfront cash | 5% nominal annually, compounded monthly |
Selling costs are tested at 0% and 6% of the sale value, with every other input held constant. The zero-cost case isolates the effect of omitting exit costs; it is not a claim that a real sale would be free.
The 20% down payment avoids introducing a private mortgage insurance estimate into this illustration. The calculator does not model PMI. It also assumes regular monthly mortgage payments and no refinancing or extra principal.
Compare costs at three, five, and ten years
| Holding period | Rent net cost | Buy net cost with no selling cost | Buy net cost with 6% selling cost |
|---|---|---|---|
| 3 years | $56,341.86 | $51,692.98 | $71,362.07 |
| 5 years | $96,325.58 | $78,983.07 | $99,850.01 |
| 10 years | $205,376.14 | $142,188.12 | $166,378.62 |
At three years, the no-selling-cost case suggests buying is cheaper by about $4,648.88. Including the selected exit cost makes buying more expensive by about $15,020.21 instead.
At five years, buying with the selected selling cost remains slightly more expensive. By ten years, buying is cheaper under these same assumptions. A five-year result and a ten-year result can therefore support different choices without either calculation being inconsistent.
When the model is run for ten years, it first finds buying cheaper at month 26 without selling costs and month 67 with 6% selling costs. The difference is 41 months in this selected scenario.
These are monthly crossover observations, not a guaranteed permanently favorable date. Other assumptions can create a different crossover, no crossover within the chosen horizon, or changing relative costs. Check the cost at your likely move date rather than treating one headline month as a promise.
At five years, the selected exit cost is about $20,866.93
With 3% annual appreciation, the modeled year-five home value is:
$300,000 × 1.03⁵ = approximately $347,782.22.
A 6% selling-cost assumption applied to that future value is:
$347,782.22 × 6% = approximately $20,866.93.
That amount explains the difference between the two five-year purchase-cost results:
$99,850.01 − $78,983.07 = approximately $20,866.93.
It is charged against the modeled sale value, not the original $300,000 purchase price. If the home appreciates, a percentage-based exit cost grows with it.
For a real scenario, collect likely transaction costs and convert them into an input that reasonably reflects the expected sale. Commissions, taxes, repairs, concessions, and other items vary; do not assume this article’s selected percentage applies to your transaction.
Also keep buyer closing costs separate from selling costs. The $9,000 paid when buying is not an allowance for a later sale. Conversely, do not add the same fee twice under different names.
The renter’s unused upfront money is part of the comparison
The buyer begins by spending $69,000: a $60,000 down payment and $9,000 of closing costs. In the model, the renter invests that same $69,000 instead.
The renter’s investment gains reduce the net cost assigned to renting. The original $69,000 is not treated as an extra rent expense or subtracted as though it were newly earned profit; it is money retained in an asset.
This treatment is important because comparing equity alone with zero renter savings would implicitly assume the renter spent all the money they did not put into the home. If that is what actually happens, the investment assumption should be changed. A theoretical portfolio that is never maintained should not be credited to the real plan.
The model invests only the initial down payment and closing-cost amount. It does not automatically invest the monthly difference between ownership expenses and rent. It also does not calculate taxes or investment fees on the renter’s portfolio. Those limitations can affect the comparison.
The compound-interest contribution guide explains why deposit timing and contribution patterns matter. Its monthly-deposit examples are separate from this tool’s initial-lump-sum portfolio.
Stress-test appreciation, rent, maintenance, and returns
Selling costs are only one input. A result that depends on smooth appreciation or favorable investment returns needs several scenarios before it informs a large commitment.
Try a lower home-appreciation assumption, a different rent increase, a larger maintenance allowance, and a lower investment return. Change one input at a time first so you can identify what moves the result. Then combine less favorable assumptions to see whether the plan is still affordable.
The model scales tax, insurance, and maintenance allowances with the home’s modeled value. Actual assessments, insurance premiums, and repair bills can behave differently and can arrive in uneven amounts.
It excludes mortgage-interest and property-tax deductions, PMI, moving costs, investment taxes, and location-specific rules. It also does not forecast correlated changes in home prices and financial markets. Use it as a structured comparison, not a complete financial plan.
Affordability is another separate question. A purchase can have an attractive long-horizon net cost while requiring more upfront cash or monthly spending than the household can support. Check the home affordability calculator and budget planner alongside the comparison.
Common questions about selling costs and break-even
Does owning for five years always beat renting?
No. In this selected example, five-year ownership with 6% selling costs remains about $3,524.42 more expensive. Different home prices, rent, rates, and holding periods change the result.
Is 6% a mandatory home-selling fee?
No. It is an illustrative combined-cost input. Use estimates appropriate to your actual transaction and review what is included.
Is the down payment itself a permanent expense?
It is an upfront cash requirement that becomes part of the ownership position. The model accounts for what would remain after selling, paying costs, and settling the mortgage rather than assuming the down payment simply disappears.
Does the model invest every monthly saving for the renter?
No. It grows the initial down-payment-plus-closing-cost amount. Monthly expense differences are not added to that portfolio automatically.
Method: hypothetical fixed-rate amortization, monthly cost sampling, annual compounded home appreciation, annual rent increases, and a renter portfolio funded with the buyer’s initial cash requirement. No tax benefits, PMI, monthly-difference investing, or transaction-specific rules are modeled.
For education and planning. Check assumptions and product terms before making a financial decision.
Put the numbers to work ↗